Introduction
mini-causal is a lightweight Python library designed for causal analysis, model comparison, and counterfactual estimation. Built with simplicity and practicality in mind, it offers an accessible entry point for exploring causal inference without the complexity of larger frameworks.
What is Causal Analysis?
Causal analysis goes beyond traditional statistical methods to understand the cause-and-effect relationships between variables. Unlike correlation, which identifies associations, causal analysis seeks to determine whether one variable truly influences another.
Use Cases
Feature importance analysis: Measure how each feature impacts model predictions
Decision Support for Feature Selection: Identify which features have the most causal impact for better feature selection
Measuring the impact of features on the model’s metrics: Quantify how features affect model performance metrics
The library is designed to fill in the gap for quantifying for features on the model’s metrics as well as for production workflow.
Key Features of Mini-Causal
Mini-Causal is an open-source machine learning library written in Python for measuring the impact of features on model performance with the use of causal inference. Built for any tabular machine learning workflow with simplicity and practicality in mind, Mini-Causal includes interactive data visualizations, tables in dataframe formats and supports both regression and classification cases.
Rank The Features By Performance Metrics:
Measure the Impact of Features on Performance Metrics:
Measure the Dependence of Metrics for a Feature:
What’s New in v0.4.2
New Methods:
causal_effect_metric- Measures feature impact on classification/regression metricscausal_effect_metric_probs- Measures feature impact on probability metrics (classification only)causal_effect_metric_loss- Measures feature impact on loss functions (hamming/log loss for classification, MAE/MSE/etc for regression)causal_effect_confusion- Measures feature impact on confusion matrix elements (classification only)causal_effect_metric_tab,causal_effect_loss_metric_tab,causal_effect_confusion_matrix_tab,causal_effect_probs_tab- DataFrame summaries
Effect Metrics:
Difference Effect: Diff_Effect = Metric_with - Metric_without
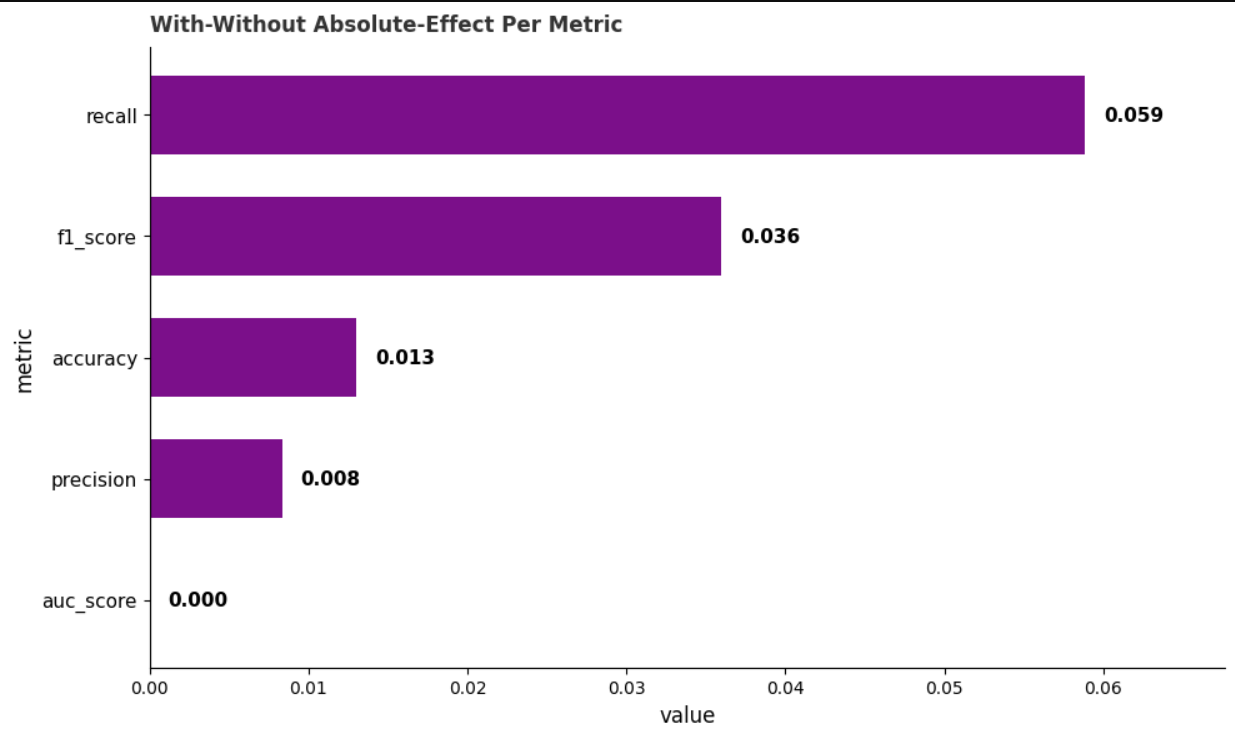
Absolute Effect: Abs_Effect = |Diff_Effect|
Relative Effect: Rel_Effect = |Abs_Effect| / Metric_without
diff_absolute_relative_effect_tab- Returns dataframe with all effect metrics
Statistical Testing:
statistical_testing- Tests distribution differences in predicted values/probabilities when feature is included vs excluded
Efficiency Scores:
Ratio Efficiency Score (RES): RES = (metrics improved with feature) / (total evaluated metrics)
Net Efficiency Score (NES): NES = (I - H) / T, where I=improved, H=harmed, T=total
Relationship: NES = 2*RES - 1 and RES = (NES+1)/2
Additional Metrics:
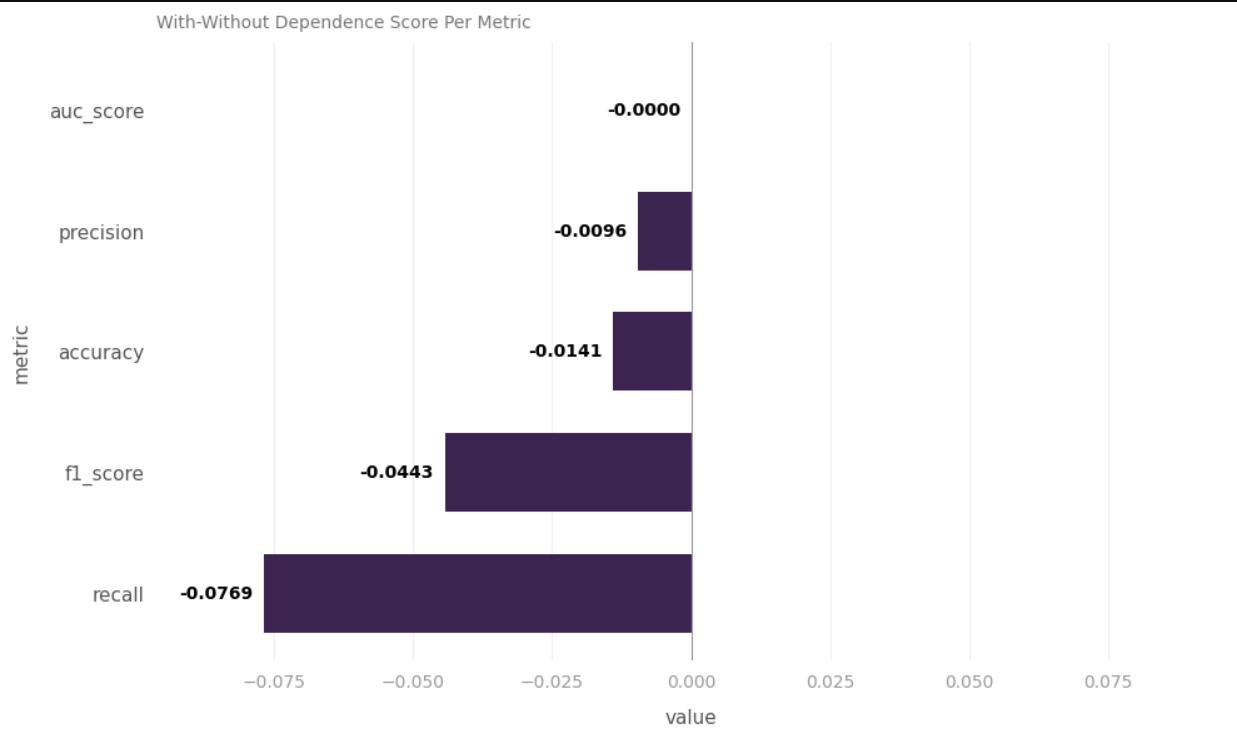
Dependence Score: Diff_Effect / Metric_with - Measures proportional value of feature inclusion
Average Metric Effect: Average of difference-effects across aggregated metrics
Feature Ranking:
feature_ranking- Ranks features based on ML metric and effect typefeature_ranking_plot- Visualizes feature rankings
Visualization:
plot_with_without_diff_effect- Diverging bar chart of difference-effectsplot_with_without_abs_effect- Diverging bar chart of absolute-effectsplot_with_without_metrics- Grouped horizontal bar chart of metricsplot_with_without_dependence- Grouped horizontal bar chart of dependence scoresplot_with_without_kde- Kernel density plot of predicted values/probabilities